--------------------------------------------------------------------
I constantly hear references to the consensus and settled science within climate change, yet on all its foundations everyone within the community is fully aware it is almost entirely based on estimates and speculation. I will now list every area I could find which means the results of using such factors for creating what they put forward as solid claims are false, as once you look at the basis of such claims, some if not most of them are based on fillers.
Models couldn't cope with the main coolants, ie aerosols, cloud formation, and where water vapour went to. That means that although the entire AGW theory is based on a small rise in temperature from CO2 causing a far greater one caused by increased water vapour, it's far too complex to model. Especially as the same evaporating oceans can cause cooling from increasing the total cloud cover.
Modelling problems
Cloud modelling problems
Conclusions
• clouds have strong and varying radiative impacts on the climate system
• clouds are the largest source of uncertainty in quantifying climate feedbacks and sensitivity
• it is very difficult to simply and accurately parameterize the small scale processes affecting clouds in a global
climate model
• anthropogenic aerosol might have a large influence on cloudiness, but the overall impact is unknown
• this is also difficult to parameterize in a global climate model
From the UN directly in 2001, confirming what anyone with school level science can work out:
"The climate system is a coupled non-linear chaotic system, and therefore the long-term prediction of future climate states is not possible."
UN IPCC Past temperatures before we measured them come from a variety of sources, mainly tree rings and ice cores. They sometimes disagree with each other. Here are the known issues trying to make a firm judgement based on them alone:
Temperatures taken before direct thermometer measurements (the oldest being the Central England records which are a few hundred years old) are estimated by proxies. The world temperature direct record begins around 1850. The details are less important than the results, but include ice cores, tree rings, and also which plants were able to grow in certain locations. But the problem here is they never stay fixed for long, but endlessly revised. This is vital, as the main argument by the scientists is it's warmer now than it has been for many thousands of years. Except until about 2001 it wasn't. There were a number of 'climate optimums', ie when the world temperature was better overall, causing fewer overall deaths as more people die of cold, more food, fewer wars and less energy use. As is the case today in a mild winter or good growing season compared to the colder alternative.
The UN IPCC made the greatest revisions, which in any other area- history, engineering, medicine, anything where records are kept and relied on, would probably be unheard of. This was the standard past temperature record taught worldwide until the 21st century.
As everyone can see from about the age of five, today's temperature and rate of change is random and normal, and most of all about bang in the middle of the range. Obviously had this been adopted by the IPCC not many scientists, politicians or the general public would have had the slightest concern over today's warming trend, as clearly it's always either warming or cooling, and the range is pretty wide. The longer period of time confirms we are at the exact peak of a regular cycle, and lower than the previous ones.
Science could not have sold such a scenario even to James Hansen (whose estimates of the 21st century are ten times higher or more than nearly everyone else's), so it was quietly dropped for the alternative which was so different it would be impossible to see how without being thoroughly incompetent at their work it would have changed from one to the other:
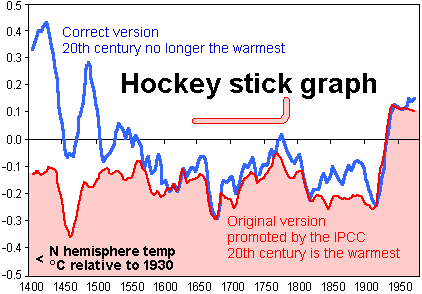
This was Michael Mann's work, which is claimed relied on eliminating hundreds of bristlecone pine (or cedar according to this diagram) records in order to raise the present, and alleged by statistician Steve McIntyre to run an algorithm which would make the same hockey stick at the end whatever figures were put in initially. And not only did they remove past higher temperatures as far back as their graphs go but a few years later they quietly merged the two without a single nod from the media.

Medieval warm period. This alone would kill the global warming hypothesis, as if it was both warmer at that time worldwide, and without either the increased CO2 causing it or any problems for mankind (the benefits were listed and are known, including many crops growing far further from the equator than today) then nothing we are experiencing now or ahead would be meaningful. Up till 2001 the UN actually acknowledged the MWP and then wrote a new graph flattening it away, followed by another half way between the two, all to be used for world policy. How can you make a theory or policy based on such unknown history?

Not only are these graphs dubious, as who are we to know which (if any) is the right one, as of course only one can be, but they form the entire basis of world climate policy, affirmed just this week in December 2015 in Paris. Clearly proxy records must be unreliable to produce at least three 21st century revisions, and absolutely different from the original.
Ice cores
Predicting the future using models was not even accepted by the IPCC. In 2001, stating the obvious anyone who understands predicting in open systems already knew, "The climate system is a coupled non-linear chaotic system, and therefore the long-term prediction of future climate states is not possible." Furthermore scientific experiments must be completable and repeatable. Setting a point from 2050-2300 as the UN IPCC reports do is outside the realm of science or logic.
Ice levels: These have been seen by satellites since 1979 (as have many other parameters such as overall temperature, as opposed to a collection of surface locations), and impossible to compare with earlier partial data. The thickness can only be measured to a fairly shallow depth while the rest is only speculated on. Claiming record ice levels only dates back to 1979 which is far too recent to have the slightest meaning.
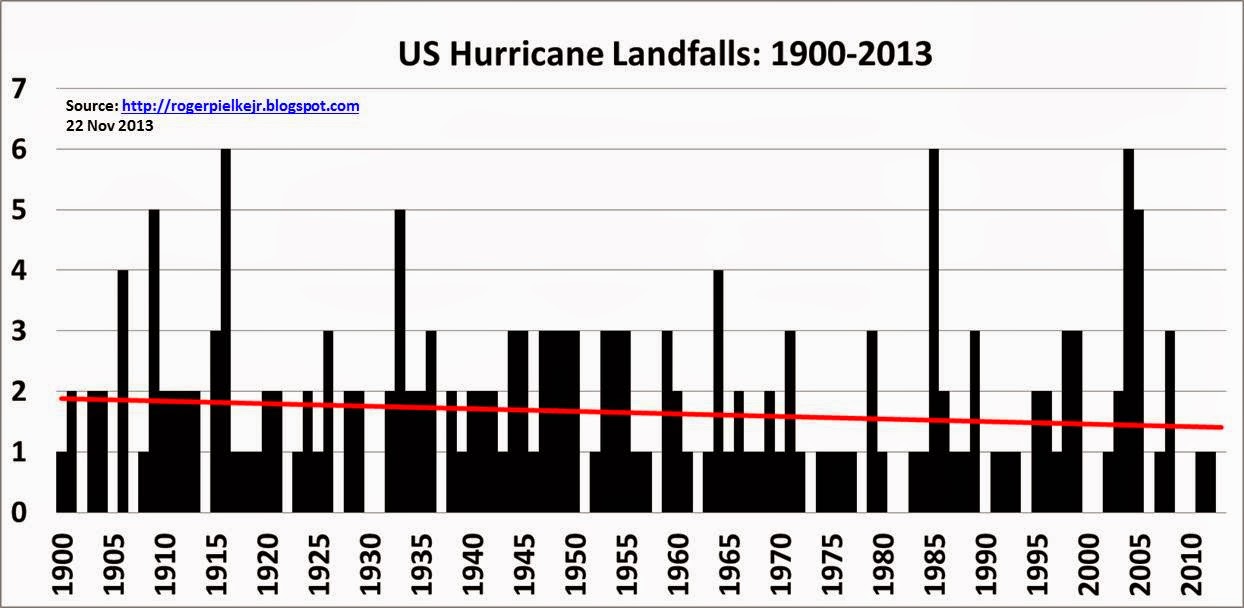
Extreme weather as temperature rises: Even the UN don't claim it's possible to either attribute individual weather events to warming, or as some claim extreme events increase with warming. They say they may increase in intensity but not in frequency. One claim is the warmer a system the more volatile, but other scientists claim this can't apply in the atmosphere. Extreme weather events can be directly recorded from the past, droughts, hurricanes, floods etc, as local historians have kept records for many hundreds of years. Most of the worst events happened long before the 21st century. Droughts for example are far worse in the past:

American hurricane landfalls have been at their lowest for a long time, which relate directly to the sea surface temperature:
The effects of a 2C rise and above. These are totally speculated as we have no knowledge past or present what such a rise could do, if anything, besides the known benefits of a rise up to 2C we know from history including greater food production, fewer wars, fewer deaths from cold and lower energy usage. As people all die from cold but not from hot weather then we know exactly what happens in every ice age from direct remains of skeletons etc, but not from warmer periods besides the benefits.
The sensitivity to CO2 is set at a default of 1C per doubling at any point, as it halves its power each time, until it can no longer hold any more heat at which point it becomes saturated. That point is totally unknown (there is currently not even a general estimate as there is no means known to do so), and may have already been reached. Every other increase is from unknown positive feedback, which is almost totally dependent on evaporating oceans lodging in the exact band which amplify the greenhouse effect. If they do not, or form more clouds, they will reduce the temperature.
Temperature adjustments are officially to fill in gaps, eliminate outliers and remove local bias, which is virtually all from urban heat islands. Random errors tend to zero, bias for heat reduces the temperature. Yet nearly all pre-adjustment temperatures (plus unknown ones never released for 'commercial reasons', whatever that means) are lower than the ones finally used. These are the American ones
but reflect anywhere else you care to mention freely available online.
Latest compromised data
Of course the greatest example, the world holocene record has already been shown above which Michael Mann redrew at apparent will. And it wasn't the only one, four were offered to the IPCC, not all similar, and his was chosen as the 'official' one, ie they decided that was the 'good' one. Until they changed it a few years later that is.
Recently in late 2015 something happened which never had before. The UN adjusted recent temperature records once they had been accepted (having already been adjusted initially). This suddenly dropped the past so the recent stall in temperatures since the late 90s vanished overnight to be replaced with more hockey stick. Prior till now nearly (?) all revision was only applied to proxies as they found better ways to measure the past, but rewriting direct recent measurements is something apparently novel in climate science altogether, and coincided with a point where over 60 (see the uncertainty there?) different reasons, from air pollution to natural cycles being given to the pause, which then suddenly disappeared.
Here it is


But overall the temperature itself is incredibly less certain than the final graphs we see in the media. There are surface temperatures, often affected by urban heat islands, and since the satellites went up measuring the temperature and ice in 1979 have been drastically reduced. They are still used though, and besides using rough methods for daily average temperatures, such as averaging the high and low points per day, they then have to try and extrapolate them worldwide, and some have been found filling in the gaps (over 70% of the total now) not with the average temperature overall but the warmer end. Besides that one example it means everything is then adjusted to correct for known issues, but rather than falling for the urban heat islands and evening to zero for the random errors nearly all local measurements can be seen to have either been ramped up or tilted down in the past to make them rise. Neither method can do this. They then use the difference from a certain point in time (the anomaly) to show the temperature change rather than absolute temperature, to see if it is rising at all, and by setting the point at the lowest for decades means it's guaranteed to make the others look higher after them. They also found one of the satellites had been reading high for years, but didn't correct the records to show the new difference, which may have accounted for much of the measured warming.
Then once satellites arrived the total ground based stations were drastically reduced, leaving many areas almost clear of them, requiring vastly more estimation to fill in the new spaces. Look at what happened by a possible coincidence after that happened.

However, as it's so hard to record the world temperature, let alone its average, we have a number of various methods, land, sea, air and since 1979 satellite. Sometimes they are similar, sometimes they are not. And with the land temperatures you have RSS, UAH, NOAA and HadCrut. Here are the graphs for the average temperature for similar periods:


But wait, the 0.8C rise (almost the only thing scientists can agree on) since 1850 can't all be down to CO2 can it? Besides the accepted fact CO2 always rises after the temperature as it's released by the oceans, the new situation of temperature being driven by CO2 is only partially tested. But look hard enough and the scientists do attribute between 25-50% of the known warming to natural causes.
The positive feedback, in fact, is what will change a trivial and innocuous rise from CO2 to the 4C plus claimed by Hansen and Greenpeace, at the very end of the IPCC 1.5-6C range in 2100. Nearly all from evaporating oceans forming water vapour which is the serious greenhouse gas, naturally accounting for 95% of the accepted 33C addition from greenhouse gases, with 1C of that down to CO2 in 1850. However, that has to both form water vapour (warming) not clouds (blocking the sun), and lodge in bands not saturated (meaning they can absorb no more heat). And it is virtually impossible to model water vapour and clouds, so the very factor between a normal gentle warming and a disaster can't be worked out till it actually happens. And NASA's Aqua and other satellites have both found CO2 is actually bumping out some water vapour, creating a cooling result, and water vapour is going down.


The same sort of issues affect sea level, obviously as it is different all day long due to the winds and the tides, so measuring an average is not as easy as it seems even though unlike the temperature there is one due to the total amount of water. But tide gauges are accurate at each point and when many have not risen much for over a century in many low lying areas it makes you wonder how they can find a rise at all overall. Also you can see the rate of rise has not increased as you'd expect, but is changing with no regular pattern at all and lower now than in 1910. It has also been claimed the direct measurements change in natural cycles. Tide gauge study
Tide
gauge accelerations oscillate significantly from positive to negative
values mostly following the PDO, AMO and NAO oscillations. In
particular, the influence of a large quasi 60–70 year natural
oscillation is clearly demonstrated in these records.” - See more at:
http://notrickszone.com/2013/04/23/duke-scientist-on-sea-level-rise-patterns-in-tide-gauge-records-mostly-driven-by-natural-oscillations/#sthash.4BHHCSZu.dpuf

History shows regular peaks between ice ages. We are currently at one right now. Every previous one was natural and part of a regular cycle. CO2 rose every time as a result of the warming ocean releasing it. None of the previous ones were caused or affected by added CO2 and our current peak is below every other one. How can anyone seeing that think anything is not normal just because it coincides with us burning more fossil fuel? That is the first assumption you would make and then dismiss.


